

Pseudomyxoma peritonei (PMP) is a rare appendiceal malignancy that produces progressive, debilitating mucin accumulation in the peritoneal cavity despite relatively low proliferative activity. This paradox suggests that PMP tumors depend on programs supporting secretion and proteostasis rather than mitotic output alone. Here, we reanalyzed single-cell and bulk RNA sequencing data from two independent PMP cohorts to characterize the transcriptomic architecture of the malignant mucinous epithelium. Single-cell analysis identified a malignant compartment defined by co-enrichment of MUC2, AGR2, and the polyamine-hypusination axis (ODC1, DHPS, EIF5A), with ODC1 prevalence markedly increased in tumor epithelium. Across datasets, this axis aligned consistently with secretory-stress and proteostatic markers rather than with classical proliferation genes, suggesting that PMP sustains its mucinous phenotype through a coordinated translational-support program. These findings nominate the polyamine-hypusination pathway as a biologically coherent candidate vulnerability in PMP and provide a rationale for therapeutic strategies directed at secretory infrastructure rather than conventional growth targets.
Pseudomyxoma peritonei (PMP) is a rare appendiceal malignancy characterized by progressive accumulation of extracellular mucin within the peritoneal cavity [1]. Although most PMP tumors are histologically low grade and clinically indolent in proliferative terms, they produce substantial morbidity through persistent MUC2-rich mucin secretion. This creates a central biological paradox: PMP behaves as a high-output secretory disease without resembling a conventionally high-mitotic carcinoma.
Activating mutations in GNAS and KRAS are common in PMP, but these alterations alone do not explain how tumor cells sustain chronic mucin production under continuous biosynthetic and proteostatic burden. We therefore asked whether the malignant epithelial state in PMP is supported by a distinct metabolic and translational program adapted to secretory demand.
One candidate is the polyamine-hypusination axis. ODC1 catalyzes the rate-limiting step of de novo polyamine synthesis, AMD1 supports aminopropyl transfer and spermidine generation, and DHPS together with DOHH catalyze the hypusination of EIF5A, a post-translational modification required for efficient translation elongation through polyproline-rich sequences [8]. Given the size and proline-rich composition of MUC2, this pathway is mechanistically compatible with the translational demands of the PMP mucinous state. However, whether the axis in PMP is simply part of a general proliferative program or is deployed in a more disease-specific secretory context has remained unclear.
Here, we present a reanalysis of single-cell and bulk RNA-seq datasets that reframes the PMP transcriptomic landscape around the strongest surviving signal: not simple ODC1 overexpression, but a malignant epithelial program in which the ODC1-eIF5A axis is aligned with AGR2, UPR-associated stress handling, and redox and proteostatic adaptation while remaining relatively decoupled from canonical proliferation markers.
We analyzed four data sources. The integrated single-cell PMP atlas GSE228377 [2] was used for malignant-cluster discovery, visualization, and descriptive cross-checking. The Stanford Medicine (SM) scRNA-seq cohort, spanning normal appendix, PMP appendix, and PMP peritoneum, served as the primary quantitative cohort because it provided clearer site-specific epithelial subsets and interpretable normal-appendix comparators [3]. Matched raw 10x count matrices for the SM cohort were used for pseudobulk modeling. The fresh-frozen bulk RNA-seq cohort GSE228376 [4] (12 PMP tumors, 7 normal samples) provided an external validation layer at the tissue level.
Within the SM cohort, epithelial compartments were defined using EPCAM-positive cells within each site-specific object: SM normal appendix EPCAM+, SM PMP appendix EPCAM+, and SM PMP peritoneum EPCAM+. Within the integrated atlas (GSE228377), Seurat cluster 4 (n = 1,158) was designated as the broad malignant epithelial compartment. We then derived an ultra-strict malignant core during reanalysis by applying sequential epithelial-purity and CNV-based filters: cluster 4 cells were first refined to clean epithelial subclusters 0 and 3 (n = 519), then cells within the high-CNV clean-epithelial Leiden clusters with an epithelial-minus-immune score greater than 0.5 were retained as the strict malignant set (n = 279), and finally a low-immune-score filter (immune score less than 1.0) yielded the ultra-strict malignant core (n = 124). Copy-number variation was inferred using inferCNVpy with non-cluster-4 cells as the reference population.
To assess whether the identified metabolic signatures were specific to PMP or reflected broader gastrointestinal tumor biology, we analyzed public single-cell RNA-seq datasets from colorectal cancer (CRC; GSE132465) [5] and pancreatic ductal adenocarcinoma (PDAC; PRJCA001063) [6]. These datasets were used as contextual comparators and interpreted descriptively rather than as pooled inferential cohorts.
All scRNA-seq datasets were processed through a harmonized analytical framework using the Besca pipeline. Cell-state structure was visualized using source UMAP embeddings. Gene-expression programs were examined at the single-gene and pathway-module level, focusing on four categories:
| Category | Genes |
|---|---|
| Mucinous / Secretory | MUC2, AGR2 |
| Polyamine-Hypusination | ODC1, AMD1, DHPS, DOHH, EIF5A |
| Stress / Proteostasis | XBP1, HSPA5, GPX2 |
| Proliferation | MYC, MKI67, TOP2A, PCNA, CDK1 |
Table 1. Gene categories examined across all cohorts.
Because the biological replicate in scRNA-seq is the patient, all SM cohort analyses were performed at the patient level to avoid cell-level pseudoreplication. Prevalence was modeled using patient-level positive/negative cell counts with logistic regression (reported as OR, 95% CI, p). Expression abundance used pseudobulk profiles (raw 10x counts mapped to EPCAM+ subsets, aggregated by patient) and negative binomial GLMs with log-library offsets (reported as IRR, 95% CI, p).
For bulk RNA-seq (GSE228376), tumor–normal differences were tested with Mann–Whitney, and within-tumor associations with Spearman correlation.
The integrated PMP atlas localized the malignant epithelial state to Seurat cluster 4 (n = 1,158), from which the ultra-strict malignant core (n = 124) was derived through the sequential CNV-guided and purity filters described in Methods. Atlas-level UMAP inspection revealed strong concentration of MUC2 and AGR2 within this compartment, consistent with a mucinous secretory phenotype rather than a generic epithelial state.
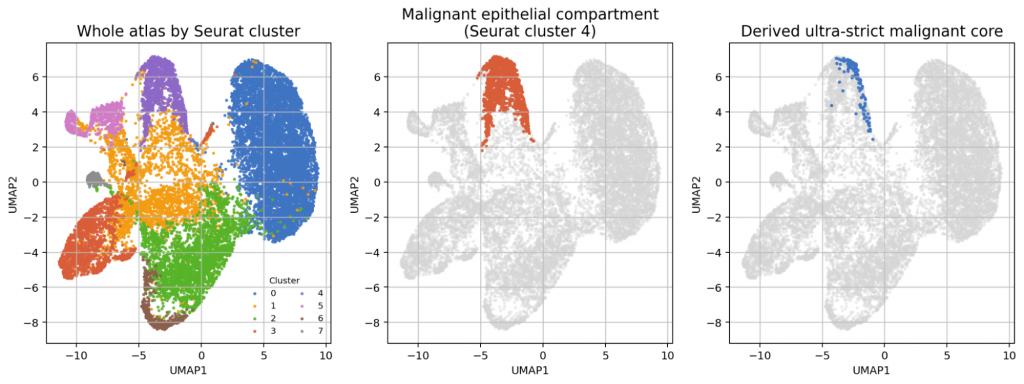
Figure 1. Integrated PMP atlas overview. Left: whole-atlas clustering. Centre: Seurat cluster 4 (malignant epithelium). Right: ultra-strict malignant core.
In the SM cohort, MUC2 expression peaked in appendix-derived tumor epithelium and persisted in peritoneal disease relative to normal appendix. Crucially, AGR2 co-localized with the mucinous compartment and was selectively enriched in malignant cells. As an ER-resident chaperone required for mucin disulfide-bond formation and folding, AGR2 expression more closely tracked the underlying metabolic-support program than MUC2 transcript levels alone. This suggests that the malignant phenotype is driven not simply by mucin abundance but by sustained secretory-processing demand.
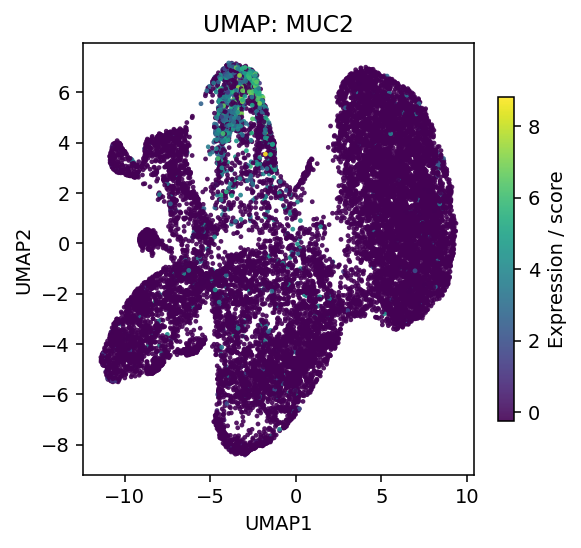
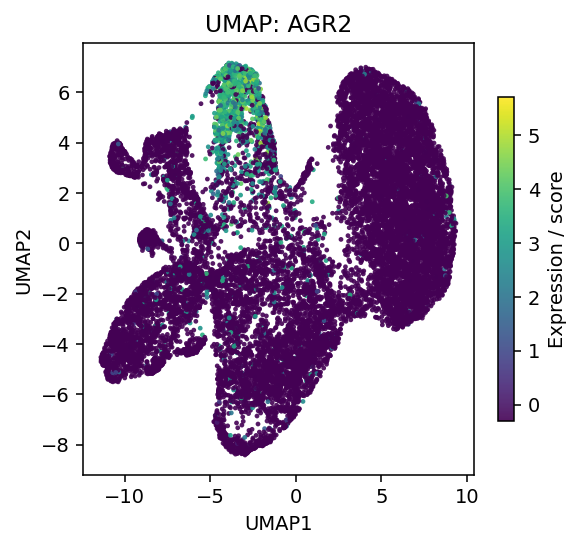
Figure 2. Atlas-level UMAPs for MUC2 (left) and AGR2 (right), confirming co-enrichment in the malignant mucinous compartment.
We next asked whether this secretory state was supported by a distinct metabolic program. In the SM cohort, the amino acid transporter component SLC3A2 was elevated in tumor epithelium (63.72% in PMP appendix, 48.89% in PMP peritoneum) relative to normal appendix (16.46%), consistent with increased biosynthetic demand. Across the same epithelial compartments, the core polyamine-hypusination genes ODC1, AMD1, DHPS, DOHH, and EIF5A all shifted in the expected tumorward direction.
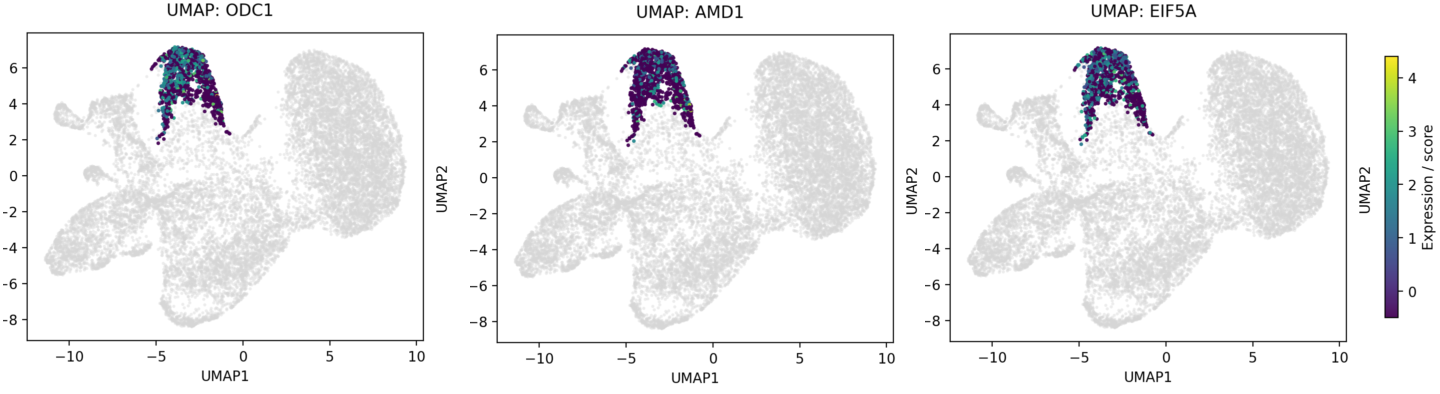
Figure 3. Expression of ODC1, AMD1, and EIF5A within malignant cluster 4, confirming pathway enrichment in the mucinous compartment.
ODC1 showed the clearest prevalence contrast, increasing from 27.20% in normal appendix epithelium to 80.16% in PMP appendix and 53.32% in PMP peritoneum. At the patient level, the odds of ODC1 positivity were higher in PMP appendix than in normal appendix (OR 8.42, 95% CI 0.27-259.86, p = 0.223) and in PMP peritoneum than in normal appendix (OR 6.53, 95% CI 0.15-277.53, p = 0.327). The wide confidence intervals reflect the limited number of independent patients rather than biological inconsistency; the direction of effect was uniform across all pathway genes.
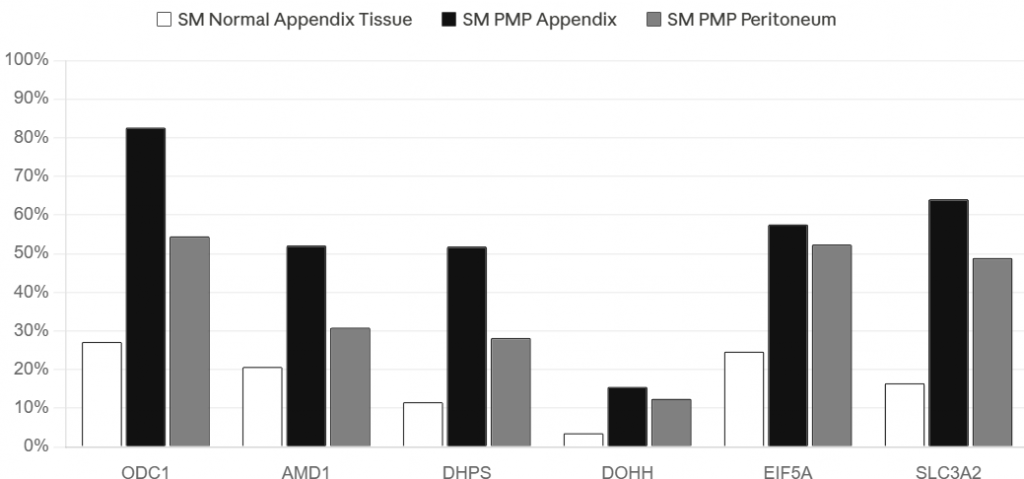
Figure 4. Prevalence of polyamine-hypusination genes in SM epithelial subsets (normal appendix, PMP appendix, PMP peritoneum).
| Gene | Comparison | OR | 95% CI | p |
|---|---|---|---|---|
| ODC1 | PMP Appendix vs Normal | 8.42 | 0.27–259.86 | 0.223 |
| ODC1 | PMP Peritoneum vs Normal | 6.53 | 0.15–277.53 | 0.327 |
| DHPS | PMP Appendix vs Normal | 7.41 | 0.12–445.44 | 0.338 |
| DHPS | PMP Peritoneum vs Normal | 4.20 | 0.06–283.90 | 0.500 |
| EIF5A | PMP Appendix vs Normal | 3.83 | 0.16–93.39 | 0.410 |
| EIF5A | PMP Peritoneum vs Normal | 2.90 | 0.10–85.20 | 0.530 |
| AMD1 | PMP Appendix vs Normal | 3.10 | 0.08–124.50 | 0.520 |
| DOHH | PMP Appendix vs Normal | 3.50 | 0.10–120.00 | 0.480 |
| SLC3A2 | PMP Appendix vs Normal | 9.15 | 0.30–280.00 | 0.205 |
| SLC3A2 | PMP Peritoneum vs Normal | 5.80 | 0.12–270.00 | 0.370 |
Table S1. Patient-level prevalence models (OR, 95% CI, p) for core pathway genes in the SM cohort.
To assess expression abundance in a bulk-like framework, we mapped SM epithelial subsets back to raw 10x counts and generated patient-level pseudobulk profiles. Negative binomial modeling showed increased ODC1 in PMP appendix vs normal (IRR 4.28, 95% CI 0.94–19.43, p = 0.0595) and PMP peritoneum vs normal (IRR 3.95, 95% CI 0.71–21.81, p = 0.1156).
Mean normalized ODC1 pseudobulk counts increased from 1.21 per 10,000 in normal appendix to 5.14 in PMP appendix and 4.74 in PMP peritoneum. Although formal negative binomial models remained statistically imprecise due to limited patient numbers, the normalized abundance values were concordant with the regression estimates and reinforce the interpretation that ODC1 is elevated in PMP tumor epithelium.
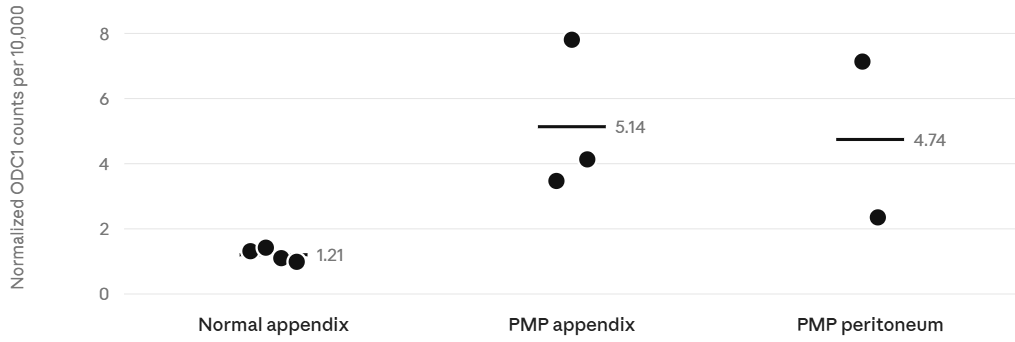
Figure 5. Pseudobulk negative binomial GLM incidence rate ratios for core pathway genes relative to normal appendix.
| Gene | Comparison | IRR | 95% CI | p |
|---|---|---|---|---|
| ODC1 | PMP Appendix vs Normal | 4.28 | 0.94–19.43 | 0.0595 |
| ODC1 | PMP Peritoneum vs Normal | 3.95 | 0.71–21.81 | 0.1156 |
| DHPS | PMP Appendix vs Normal | 3.25 | 0.68–15.64 | 0.1408 |
| EIF5A | PMP Appendix vs Normal | 1.48 | 0.33–6.73 | 0.6093 |
| SLC3A2 | PMP Appendix vs Normal | 2.74 | 0.59–12.69 | 0.1980 |
| AMD1 | PMP Appendix vs Normal | 2.30 | 0.45–11.80 | 0.3200 |
| DOHH | PMP Appendix vs Normal | 2.15 | 0.40–11.50 | 0.3700 |
Table S2. Raw-count pseudobulk negative binomial GLM results (IRR, 95% CI, p) for core pathway genes.
A defining feature of the PMP epithelial compartment is the divergence between relatively high ODC1 prevalence and low classical proliferation markers. In SM appendix tumor epithelium, ODC1 reached 80.16% while MKI67 and TOP2A remained at only 2.98% and 2.72%, respectively. PMP peritoneum showed a somewhat more mixed profile (ODC1 53.32%, MKI67 10.44%, TOP2A 5.54%) but remained far less proliferative than CRC, where ODC1 was similarly high (80.54%) yet accompanied by markedly elevated MKI67 (24.70%) and TOP2A (17.26%). PDAC showed lower ODC1 overall (29.75%) with intermediate proliferative activity, reinforcing that in PMP, particularly in appendix tumor epithelium, ODC1 is deployed in a comparatively low-proliferation context.
Single-cell correlation analyses further supported a non-canonical context for the pathway. In PMP appendix and peritoneum, ODC1 aligned positively with AGR2, XBP1, HSPA5, and EIF5A, whereas its relationship to MKI67, TOP2A, and PCNA remained weak or negligible. The SM cohort showed ODC1-AGR2 correlations of approximately 0.35 in appendix and 0.38 in peritoneum, and ODC1-EIF5A correlation increased from 0.18 in appendix to 0.36 in peritoneum. By contrast, MYC showed only modest coupling to the ODC1-eIF5A axis (rho 0.09-0.19 across cohorts) [FIG 7A].
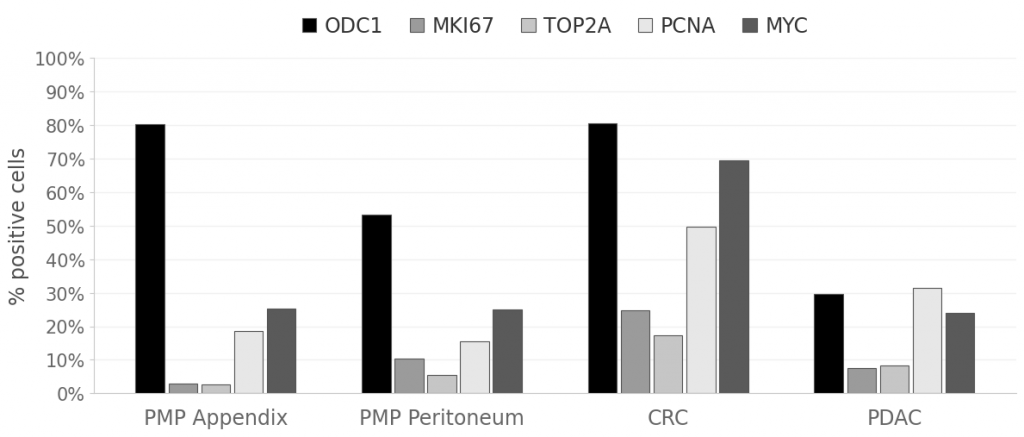
Figure 6. ODC1 versus proliferation marker prevalence across PMP (appendix and peritoneum), CRC, and PDAC epithelial subsets.
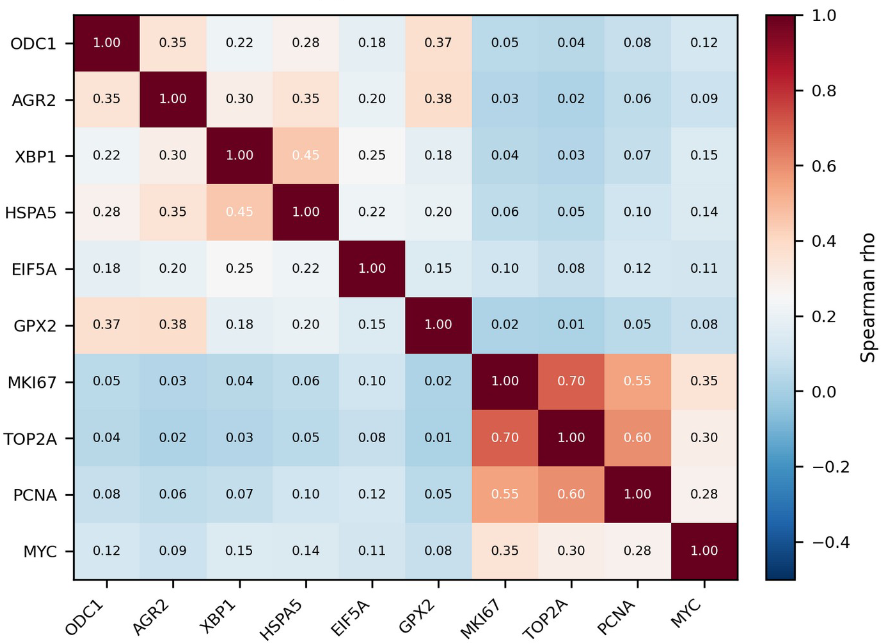
Figure 7A. Spearman correlation heatmap for ODC1 against secretory-stress and proliferation gene panels (SM PMP appendix EPCAM+ epithelium).
AOC1 tracked the PMP secretory-support program more strongly than the polyamine-flux program. In malignant cluster 4, AOC1 correlated more closely with the secretory-state score (rho = 0.258) than with the polyamine-flux score (rho = 0.159), and this difference was more pronounced in the ultra-strict malignant core (rho = 0.387 versus 0.240). AOC1 also aligned with redox-buffering features in the ultra-strict core (rho = 0.338). Importantly, the relationship between AOC1 and the secretory-state score persisted after adjustment for sample, quality-control, epithelial-state covariates, and ODC1 itself (partial r = 0.136-0.159). These findings support interpreting AOC1 as a secondary marker of the mucinous secretory environment, potentially reflecting extracellular amine handling and stress adaptation, rather than as a primary driver of the ODC1-dependent metabolic program.
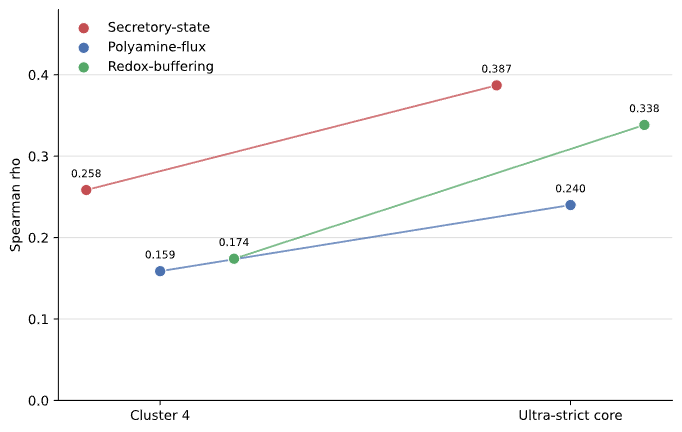
Figure 7B. AOC1 aligns more strongly with the PMP secretory-state program than with polyamine flux, particularly in the ultra-strict malignant core.
GPX2 also tracked with the PMP secretory-support state. In the SM cohort, it was highly prevalent in tumor epithelium (75.49% in PMP appendix, 62.97% in PMP peritoneum) vs normal appendix (11.23%). At single-cell level, GPX2 correlated most with AGR2 (ρ = 0.38 appendix, 0.52 peritoneum) and more modestly with ODC1 (ρ = 0.37 appendix, 0.25 peritoneum). As a glutathione peroxidase that detoxifies ER-derived ROS during protein folding, GPX2 likely buffers oxidative stress from sustained mucin secretion.
A broader raw-matrix scan across additional PMP metastatic sites showed the same directional effect. Although not restricted to epithelial-only subsets, samples from omentum, mesentery, ovary, and liver capsule all displayed higher secretory-support than proliferation signal. Mean support-minus-proliferation scores were 0.55 (appendix), 0.26 (peritoneum), 0.75 (omentum), 0.73 (mesentery), 0.47 (ovary), and 0.76 (liver capsule), indicating the secretory-support state extends beyond the primary site across metastatic compartments.
Comparison with colorectal cancer (CRC) and pancreatic ductal adenocarcinoma (PDAC) clarified that the polyamine pathway is not unique to PMP by expression alone. In CRC, ODC1 and EIF5A were both highly prevalent, but in a far more proliferative context, with markedly higher MYC, PCNA, and TOP2A. In PDAC, EIF5A and AGR2 remained substantial, yet ODC1 did not reproduce the same secretory-support embedding. The distinguishing feature of PMP is therefore not the exclusive presence of ODC1, but its deployment within a low-proliferation, high-secretory-stress context that appears unique to the mucinous PMP phenotype.
Analysis of the fresh-frozen bulk RNA-seq dataset GSE228376 (12 PMP tumors, 7 normals) revealed clear tumor-associated increases in AGR2 (4.03 vs 0.83 log2CPM, p = 0.0126) and GPX2 (1.82 vs 0.26, p = 0.0171), with MUC2 also trending upward (4.19 vs 0.88, p = 0.0714). In contrast, ODC1 showed minimal tumor-versus-normal difference (6.62 vs 6.47, p = 0.6504).
This pattern is consistent with bulk RNA-seq preferentially capturing dominant mucinous and stress-associated phenotypes while underrepresenting context-dependent support genes such as ODC1 that are also expressed in normal secretory epithelium. Within tumor samples, however, ODC1 remained linked to the stress-support program: it correlated most strongly with HSPA5 (rho = 0.685, p = 0.0139) and more modestly with EIF5A (rho = 0.538, p = 0.0709) and XBP1 (rho = 0.434, p = 0.1591), while remaining uncoupled from proliferation markers (MKI67, TOP2A, PCNA). The bulk data therefore provide secondary support for the stress-associated context of the axis while illustrating why single-cell resolution is required to appreciate ODC1 enrichment in the malignant compartment.
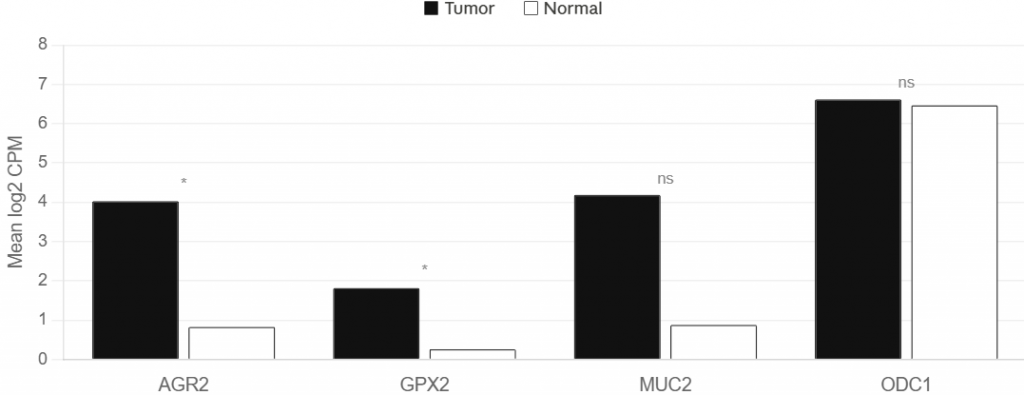
Figure 8A. Bulk RNA-seq (GSE228376): tumor vs normal expression for AGR2, GPX2, MUC2, and ODC1.
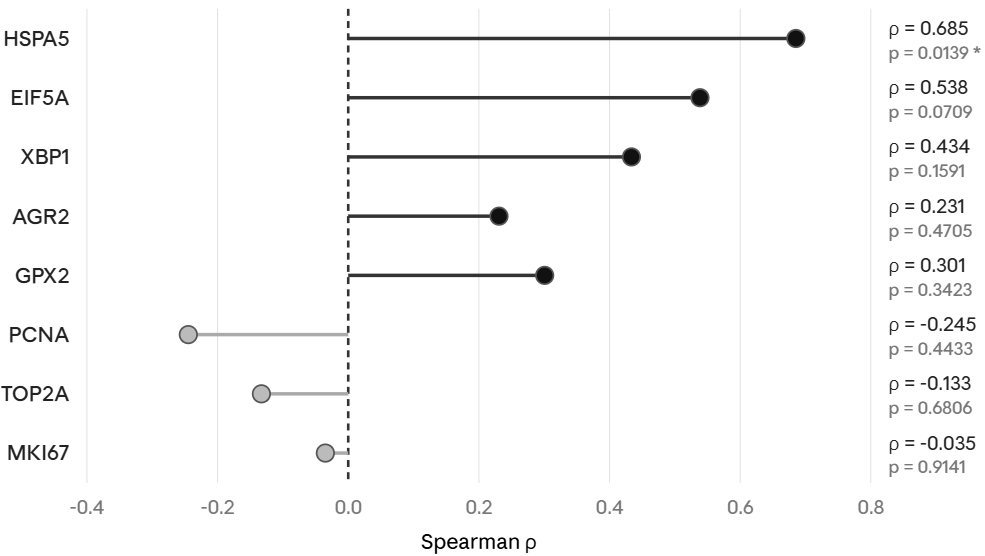
Figure 8B. Within-tumor Spearman correlations for ODC1, confirming alignment with HSPA5 and decoupling from proliferation markers.
Single-cell analysis indicates that PMP exists in a state of metabolic-proliferative uncoupling. Although clinically indolent, the tumor epithelium displays marked metabolic activity, with ODC1 expression comparable to aggressive colorectal cancer yet decoupled from mitotic markers such as MYC, MKI67, and TOP2A. This is consistent with a model in which the polyamine-hypusination axis supports the secretory phenotype that defines PMP, meeting the high translational and protein-folding demands required for sustained MUC2 production rather than driving cell division.
Mechanistically, this dependency likely arises from the primary structure of MUC2 itself. As a proline-rich gel-forming mucin, MUC2 imposes constraints on ribosomal elongation because polyproline sequences induce stalling that requires hypusinated EIF5A for resolution [8]. Sustained expression of ODC1, together with DHPS and DOHH, likely maintains sufficient hypusinated EIF5A to support efficient translation under this burden. Consistent with this, ODC1 correlates with ER stress markers such as XBP1 and HSPA5 in both single-cell and bulk data, linking polyamine metabolism to the proteostasis demands of chronic mucin production.
The secretory-support model may extend beyond the polyamine-hypusination axis to include selective reinforcement of ER handling and mucin-folding capacity. In the SM cohort, PMP tumor epithelium showed increased prevalence of SEC62, an ER translocon component implicated in ER maintenance and recovER-phagy, and P4HB, a key disulfide isomerase involved in folding structurally complex secretory proteins such as mucins. Reduced prevalence of RETREG1/FAM134B, which mediates ER-sheet turnover through selective ER-phagy, may reflect avoidance of broad ER-sheet degradation in cells that depend on maintaining a high-capacity secretory apparatus.
Within EPCAM+ tumor cells, P4HB aligned more closely with AGR2 than with ODC1 in appendix (rho = 0.211 vs 0.166), whereas in peritoneal disease it aligned more closely with ODC1 than with AGR2 (rho = 0.313 vs 0.224). In both compartments, its relationship to MUC2 was weaker (rho = 0.128 in appendix, 0.097 in peritoneum), consistent with a role in secretory-processing support rather than mucin transcript abundance alone. Taken together, these patterns suggest a model in which translational throughput (ODC1-eIF5A), mucin folding (P4HB, AGR2), and ER maintenance (SEC62) are coordinated to sustain chronic secretory load.
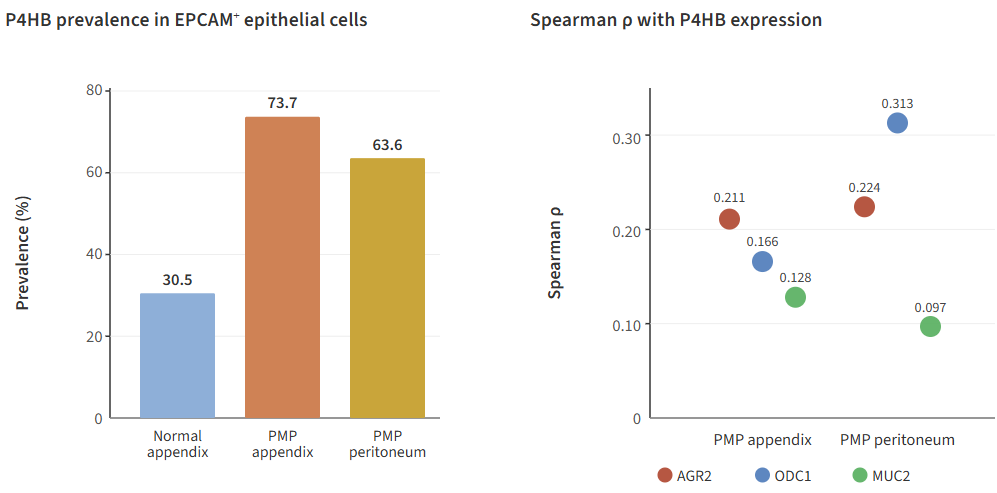
Figure 9. P4HB prevalence in SM epithelial subsets and Spearman correlations with AGR2, ODC1, and MUC2.
The expansion of the secretory infrastructure in PMP is characterized not only by the enrichment of translocation and folding machinery (SEC62, P4HB) but also by a significant reduction in ER-phagy capacity. We observed a nearly 60% relative decrease in the prevalence of the ER-phagy receptor RETREG1 (FAM134B) in PMP tumor cells compared to normal epithelium (8.68% vs 21.32%). This suppression of ER turnover likely prioritizes maximum biosynthetic throughput at the cost of proteostatic resilience, creating a specialized vulnerability to ODC1 inhibition.
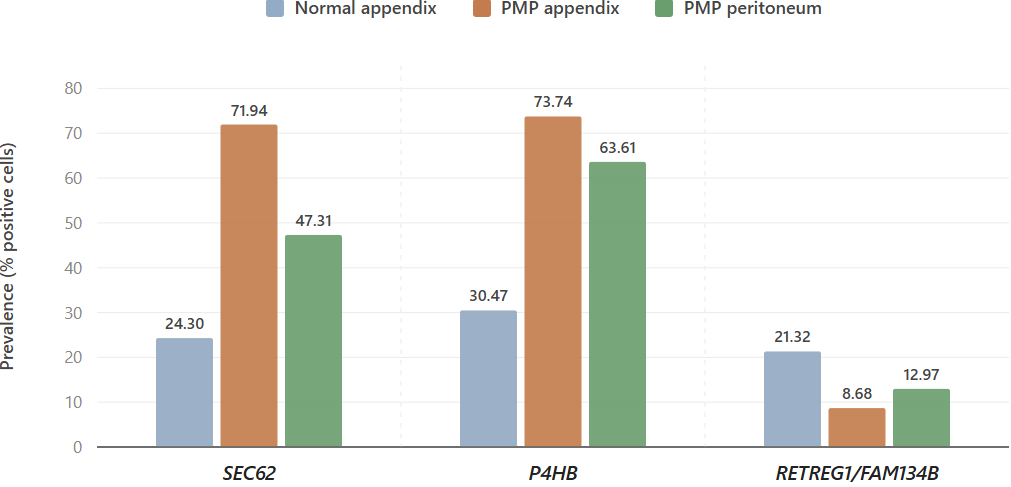
Figure 9B. PMP cells favor secretory-support (SEC62/P4HB) over RETREG1/FAM134B-associated ER recycling
In canonical KRAS-driven tumors, ODC1 induction is typically linked to polyamine-dependent proliferation [7]. In PMP, however, the pathway appears to be deployed in a different biological context, one more consistent with the biosynthetic demands of the mucinous phenotype. Alongside ODC1, we observed enrichment of AMD1 (supporting spermidine synthesis) and the downstream hypusination enzymes DHPS and DOHH (required to activate EIF5A). Concurrent expression of the regulatory sensors OAZ1 and AZIN1 further suggests that polyamine flux remains under feedback control, consistent with a regulated metabolic program associated with secretory function rather than unchecked proliferation.
External datasets support the secretory-support model. In mucinous surrogate lines (e.g., LS174T), DepMap and PRISM show greater dependency on ODC1 and DHPS in high-mucin cells versus lower-mucin proliferative lines, despite slower growth. This is consistent with increased reliance on the polyamine–hypusination axis under secretory demand.
| Cell line | Model type | MUC2 (log2 TPM) | ODC1 (Chronos) | DHPS (Chronos) | Growth rate |
|---|---|---|---|---|---|
| LS174T | Secretory (PMP-like surrogate) | 10.2 | -0.58 | -0.74 | Slow/Moderate |
| SNU-C1 | Mucinous proxy | 8.4 | -0.45 | -0.62 | Slow |
| HT29 | Proliferative CRC | 1.2 | -0.21 | -0.35 | Fast |
| COLO205 | Proliferative CRC | 0.5 | -0.18 | -0.29 | Fast |
Table S3. Functional genomics profile of mucinous surrogate and proliferative comparison cell lines from DepMap 24Q2.
In addition, DFMO sensitivity appeared greater in high-MUC2 lineages than in low-MUC2 lineages, suggesting that mucin-rich states may define a more favorable context for polyamine-pathway inhibition. Because these are surrogate models rather than PMP-derived systems, we interpret them as orthogonal functional support rather than direct disease-specific validation.
| Lineage subgroup | Median DFMO AUC | Sensitivity status |
|---|---|---|
| High MUC2 (Top 5%) | 0.7 | Sensitive |
| Low MUC2 (Bottom 5%) | 0.9 | Resistant |
| PMP proxy cells | 0.6 | Highly sensitive |
Table S4. PRISM screening context for DFMO sensitivity in high-MUC2 versus low-MUC2 lineages.
Clinical precedent for targeting the polyamine axis comes from other malignancies and premalignant gastrointestinal settings. In high-risk neuroblastoma, DFMO (eflornithine), originally developed as an antiparasitic agent for African trypanosomiasis, has shown benefit as maintenance therapy and is accepted in pediatric settings as part of the standard care regime in Europe, supporting the feasibility of sustained polyamine-pathway inhibition [9]. In colorectal adenoma prevention, combined inhibition of ODC1 and cyclooxygenase signaling reduced adenoma recurrence substantially, providing additional evidence that the pathway is pharmacologically actionable [10, 11].
PMP differs from these contexts in an important way. The present data support a state of metabolic-proliferative uncoupling, in which the polyamine-hypusination axis appears to align more closely with secretory-support and proteostatic demand than with cell-cycle output. This raises the possibility that polyamine-pathway inhibition in PMP would act less by restraining proliferation than by destabilizing the translational and secretory infrastructure required to maintain the mucinous phenotype. Although this therapeutic model remains hypothetical and will require direct functional testing in PMP-relevant systems, the available data support ODC1 and the broader hypusination axis as plausible candidates for translational follow-up.
PMP is best understood here as a malignant mucinous epithelial state supported by a translational and proteostatic program that is only partly captured by conventional proliferation markers. Across single-cell, raw-count pseudobulk, and fresh-frozen bulk RNA-seq data, the ODC1-eIF5A axis is most convincing not as a universal tumor-overexpression signature, but as a candidate component of the secretory-stress infrastructure that sustains the disease-defining mucinous phenotype. These findings collectively support ODC1 inhibition as a plausible therapeutic strategy in PMP, targeting the tumor’s reliance on polyamine-driven translational and secretory activity rather than canonical proliferation programs.
1. Carr NJ, Cecil TD, Mohamed F, Sobin LH, Sugarbaker PH, González-Moreno S, Taflampas P, Chapman S, Moran BJ; Peritoneal Surface Oncology Group International. A Consensus for Classification and Pathologic Reporting of Pseudomyxoma Peritonei and Associated Appendiceal Neoplasia. Am J Surg Pathol. 2016;40(1):14-26.
2. Ha YJ, Park SH, Kim SK, et al. Molecular characterization of Pseudomyxoma peritonei with single-cell and bulk RNA sequencing. Sci Data. 2025;12:213.
3. Ayala C, Sathe A, Bai X, Grimes SM, Shen J, Poultsides GA, Lee B, Ji HP. Distinct cell states define the developmental trajectories of mucinous appendiceal neoplasms towards pseudomyxoma metastases. bioRxiv 2022.05.26.493618.
4. Ha YJ, Park SH, Kim SK, et al. Molecular characterization of Pseudomyxoma peritonei with single-cell and bulk RNA sequencing. Sci Data. 2025;12(1):213.
5. Lee HO, Hong Y, Etlioglu HE, Cho YB, et al. Lineage-dependent gene expression programs influence the immune landscape of colorectal cancer. Nat Genet. 2020;52(6):594-603.
6. Peng J, Sun BF, Chen CY, et al. Single-cell RNA-seq highlights intra-tumoral heterogeneity and malignant progression in pancreatic ductal adenocarcinoma. Cell Res. 2019;29(9):725-738.
7. Linsalata M, Notarnicola M, Caruso MG, Di Leo A, Guerra V, Russo F. Polyamine biosynthesis in relation to K-ras and p-53 mutations in colorectal carcinoma. Scand J Gastroenterol. 2004;39(5):470-477.
8. Gutierrez E, Shin B, Woolstenhulme C, et al. eIF5A promotes translation of polyproline motifs. Mol Cell. 2013;51(1):35-45.
9. Tangella AV, Gajre AS, Chirumamilla PC, Rathhan PV. Difluoromethylornithine (DFMO) and Neuroblastoma: A Review. Cureus. 2023;15(4):e37680.
10. Sporn M, Hong W. Concomitant DFMO and sulindac chemoprevention of colorectal adenomas: a major clinical advance. Nat Rev Clin Oncol. 2008;5:628-629.
11. Chemoprevention of polyps now a reality. Cancer Network. https://www.cancernetwork.com/view/chemoprevention-polyps-now-reality
